Climate
Climate Overview
North Dakota’s climate is continental and is characterized by large variances in temperature, both on a seasonal and daily basis.
Precipitation ranges from low to moderate, and air flow through the region creates windy conditions.
Average season (April – September) precipitation for 30 year period ending 2010.
Air Masses
North Dakota is affected by regular changes in atmospheric air masses.
Air masses from the polar region bring cold, dry air to the state.
Northern Pacific air masses produce warmer, drier conditions, and tropical masses bring warm, wet weather.
The Rocky Mountains frequently block air masses from the southern Pacific Ocean from reaching the state.
Temperature
North Dakota’s average annual temperature ranges from 37° F in the northern part of the state to 43° F in the south. January is the coldest month. Temperatures average from 2° F in the north to 17° F in the southwest with an average of fifty days below 0˚.
July is the warmest month with temperatures averaging 67° F in the north and 73° F in the south. Temperatures over 90˚ are common.
North Dakota’s highest temperature was 121° F and the lowest -60° F, were both recorded in 1936.
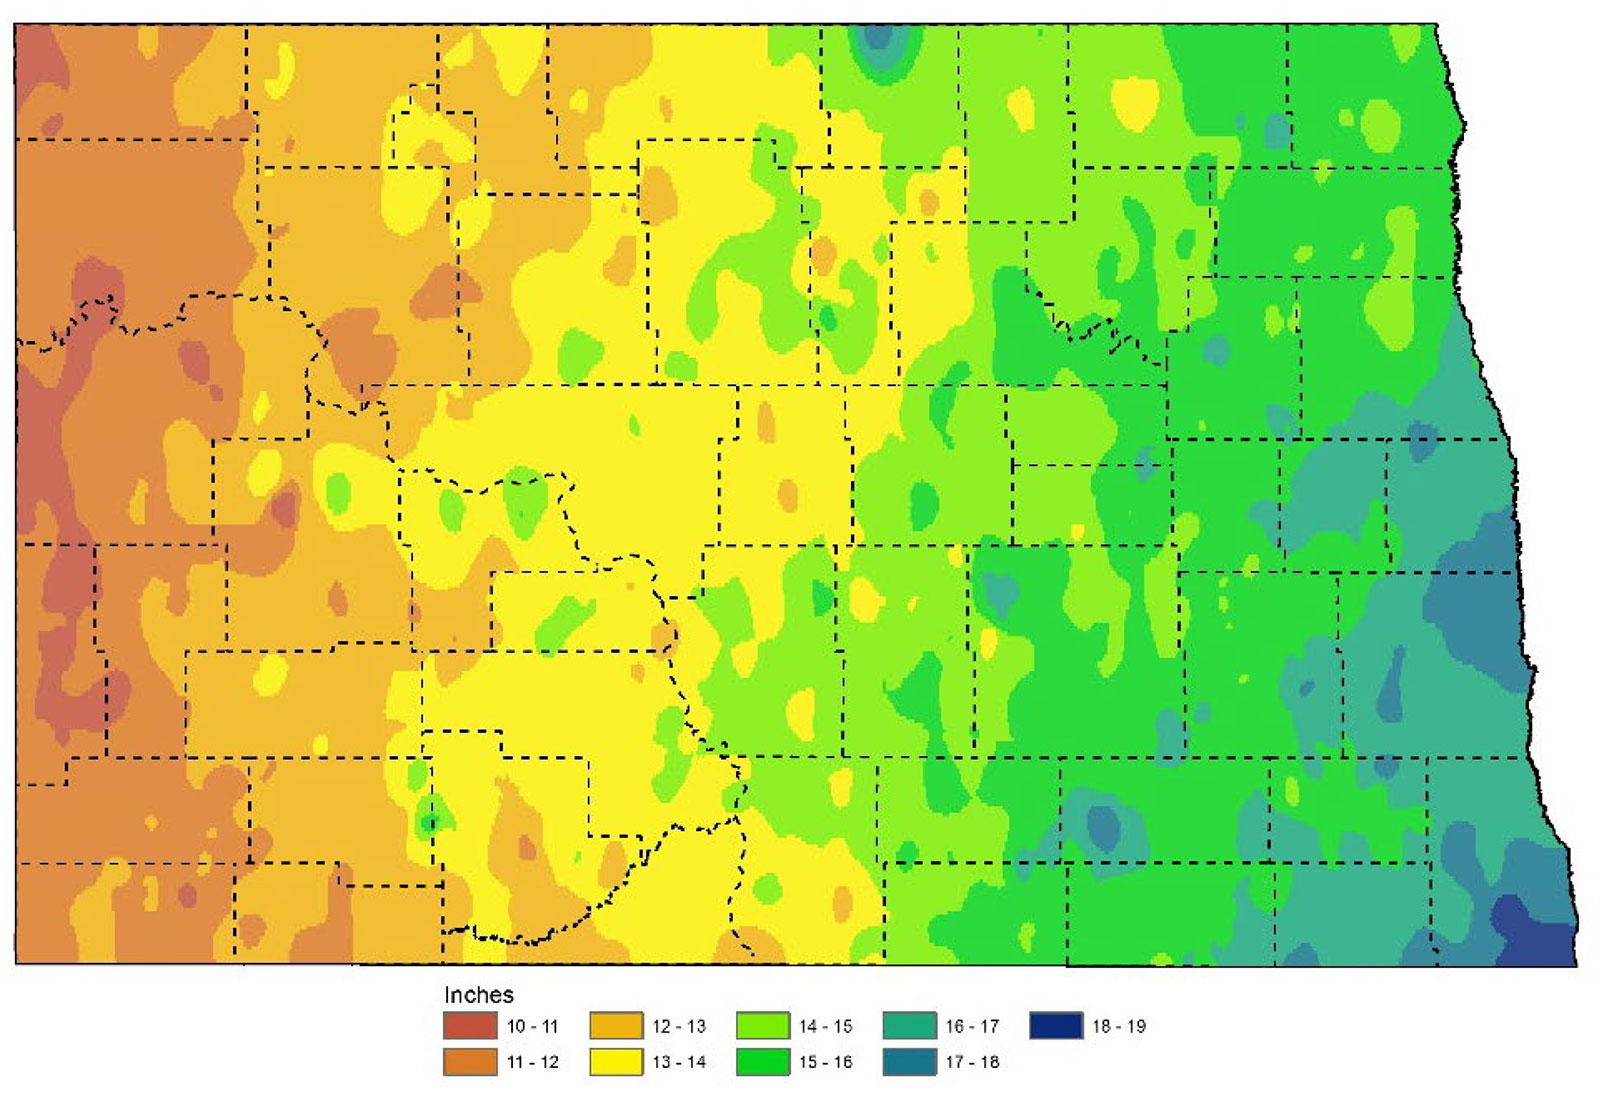
Precipitation
Annual precipitation ranges from 13 to 20 inches a year.
The average increases from west to east, with the southeast receiving the highest average precipitation.
Winter precipitation is highest in January. June is the wettest month receiving 3 to 4 inches of rain.
Areas such as the Turtle Mountains receive higher rainfalls than the surrounding plains, due to higher elevations.
A Changing Climate
Shifts in long-term temperatures and precipitation patterns, as well as the frequency of extreme events, and seasonality, is referred to as climate change.
As these patterns shift, North Dakota could be impacted in several ways: more severe droughts, increased flooding, changes in growing season, etc.
It is important to understand climate change and predicted patterns to anticipate and prepare for how a changing climate alone, or in combination with other threats, might impact the state’s wildlife and habitat.
The following section consists of future projections of key climate variables, selected by subject matter experts, crucial for consideration for North Dakota wildlife and habitats.
These focal climate variables include growing season length, temperature minimum and maximums, precipitation and its seasonality, drought, and flood risk.
Justification for Approach:
A climate change scenario planning approach was used to select a set of plausible yet contrasting future conditions that encompass the range of critical uncertainties for the climate variables of interest in North Dakota (Lawrence et al., 2021; Miller et al., 2022).
The time-period used for all climate projections is a mid-century planning period centered around 2055 (2040 - 2069); this time period allows the incorporation of climate change into both short-term and long-term planning.
A combination of 20 global circulation models CMIP5 (GCMs) for two emission scenarios (RCP4.5 RCP 8.5) were used to select the representative potential climate futures; divergent GCM-RCP combinations were assessed by examining bivariate plots of the following climate variables: wintertime (Dec-Feb) minimum temperature, wintertime (Dec-Feb) precipitation, summer (Jun - Aug) precipitation, growing season length, climatic water deficit, spring runoff, and days with a heat index > 90°.
Chosen models had adequate model performance (Joyce & Coulson, 2020).
The following GCM-RCP combination were chosen to represent two scenarios:
- HadGEM2-ES365 RCP 8.5 [hotter conditions throughout the year, increase in wintertime precipitation and decrease in summertime precipitation, extended growing season with increased summertime drought]; ‘hot drought’
- GFDL-ESM2M RCP 4.5 [warmer conditions largely evident in winter, averaged wintertime precipitation and increased summertime precipitation, no change in growing season length, reduced summertime drought]; ‘warm and wet’
The maps provided below, with bulleted main take-aways, represent the two projected climate scenarios that span the range of critical uncertainties across key climate variables.
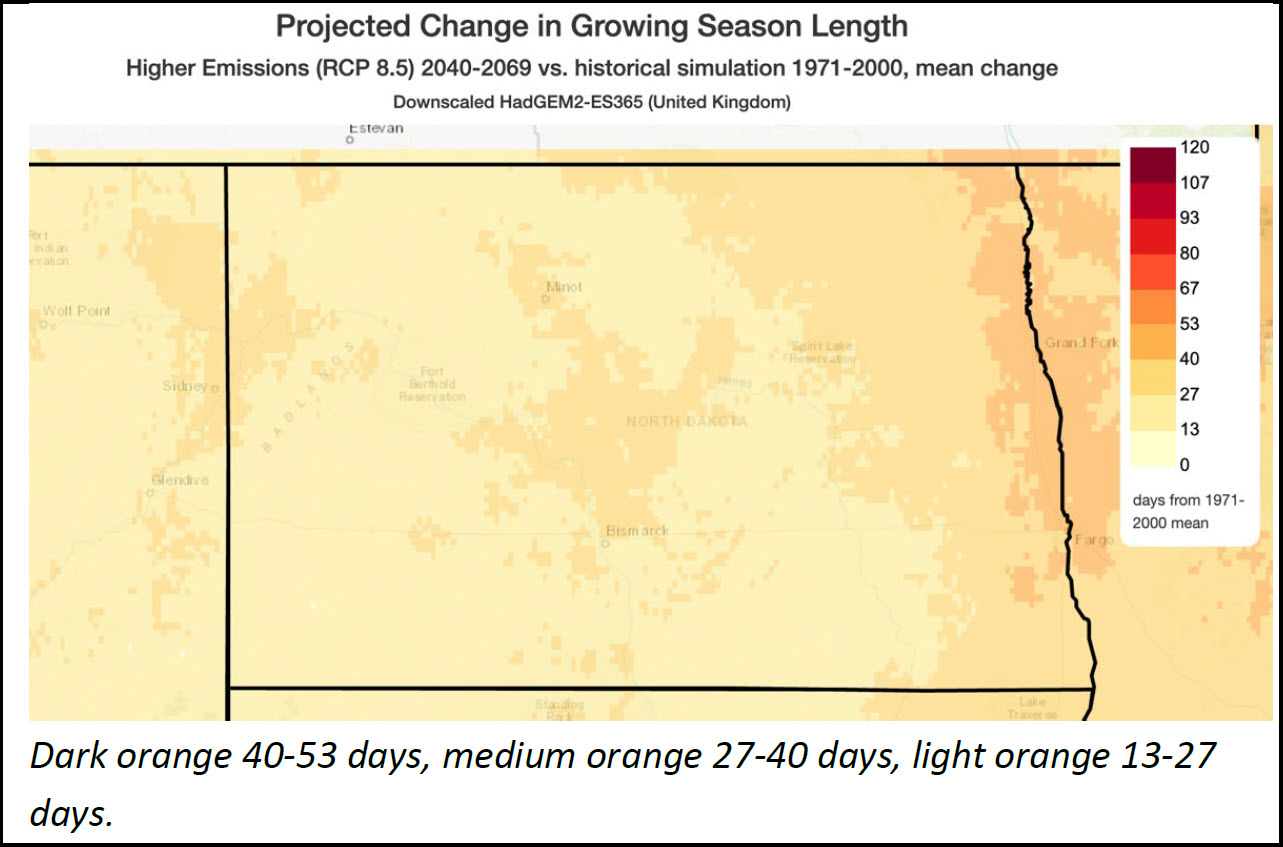
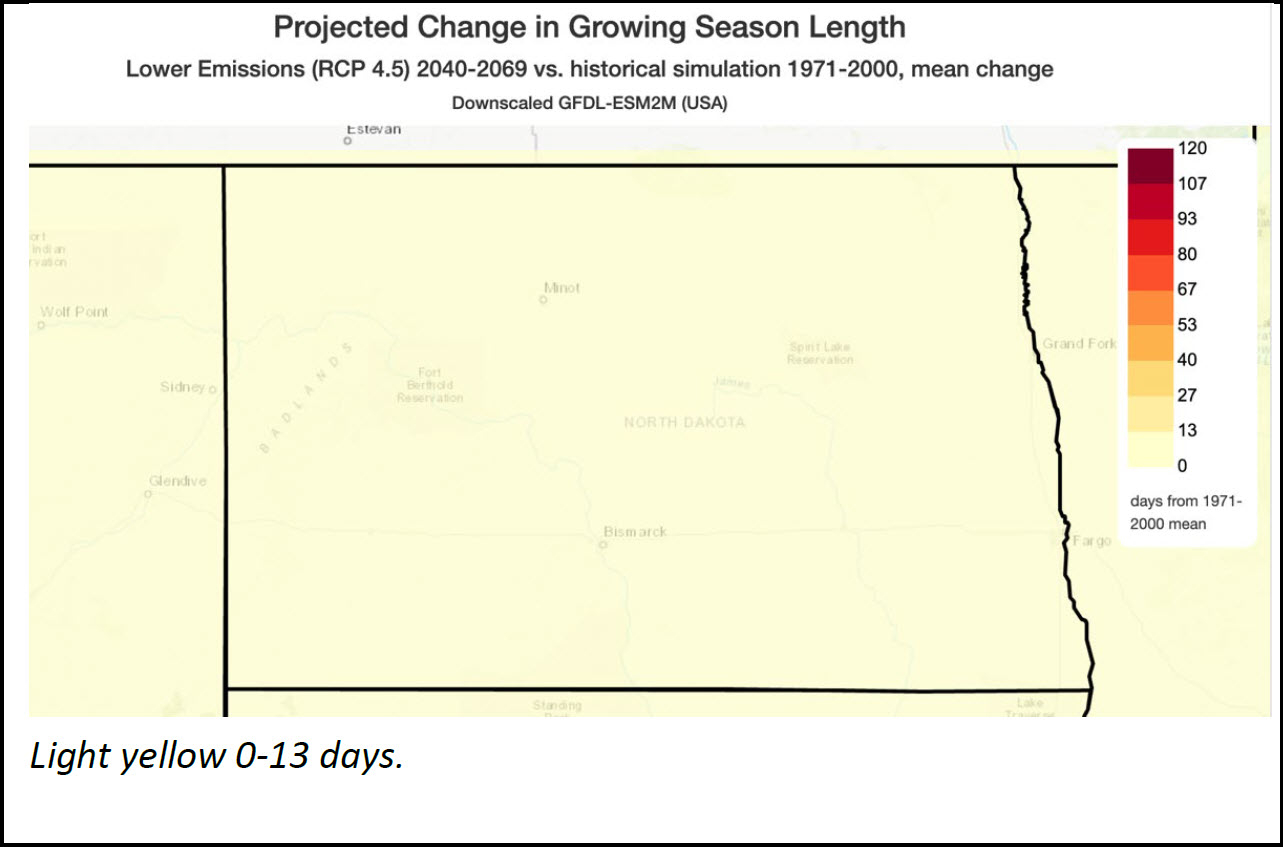
Growing Season Length
- Growing seasons and frost-free periods are lengthening due to rising temperatures. Although, these changes may be beneficial for some crops and habitats, crop yields and habitat productivity may be negatively impacted due to heat and moisture stress, increase weed competition, and pest expansion. (Figure 6) (NCA5).
Figure 6. Projected growing season length for both 'scenarios'.
Temperature Minimums and Maximums
- Since 1900, the annual average temperature in the Northern Great Plains has increased by 1.6-2.6 degrees F, and North Dakota has experienced the largest increase in the region (NCA5). While ND’s summers have “warmed little,” the number of very cold days has decreased across the region; since 2000, North Dakota’s number of very cold days has been below the long-term average. (NCA5) A winter warming trend is projected to increase with changing climate (Figure 7).
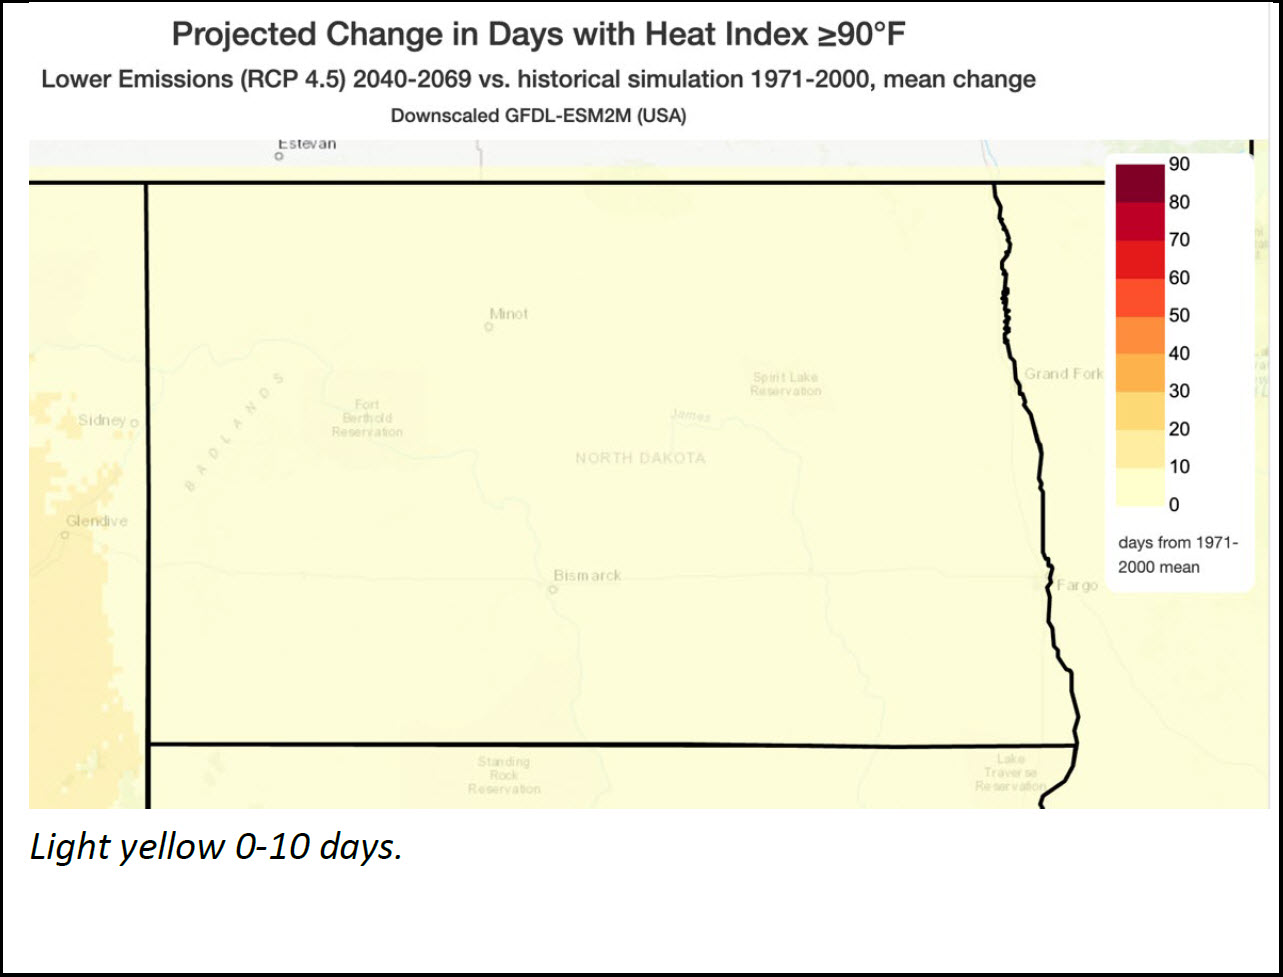
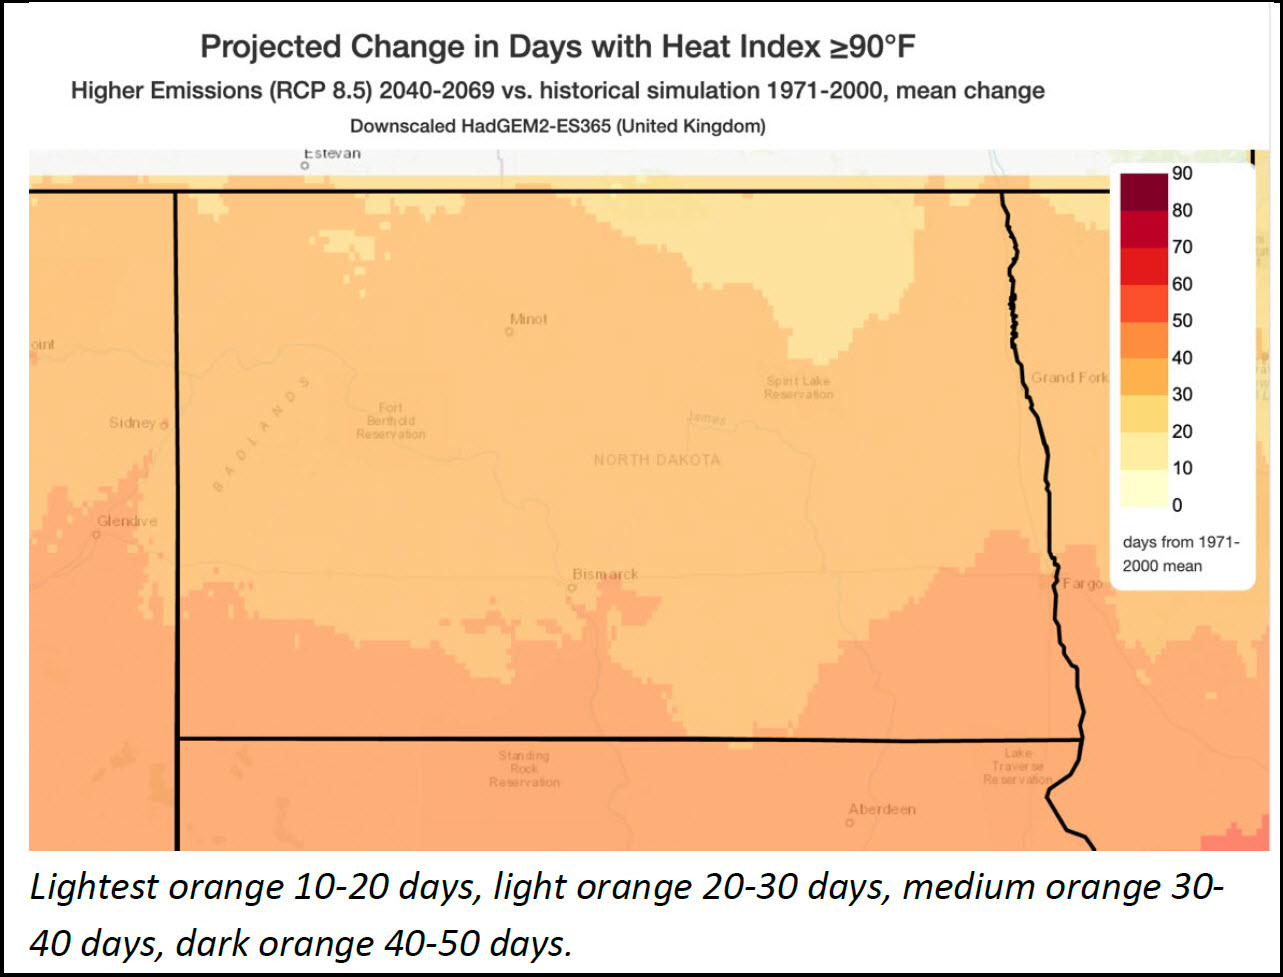
- Extremely hot days (days with a heat index over ≥ 90°C are also expected to increase with projected climate change in North Dakota (Figure 8).
Figure 7. Projected wintertime minimum temperature for both ‘scenarios.’
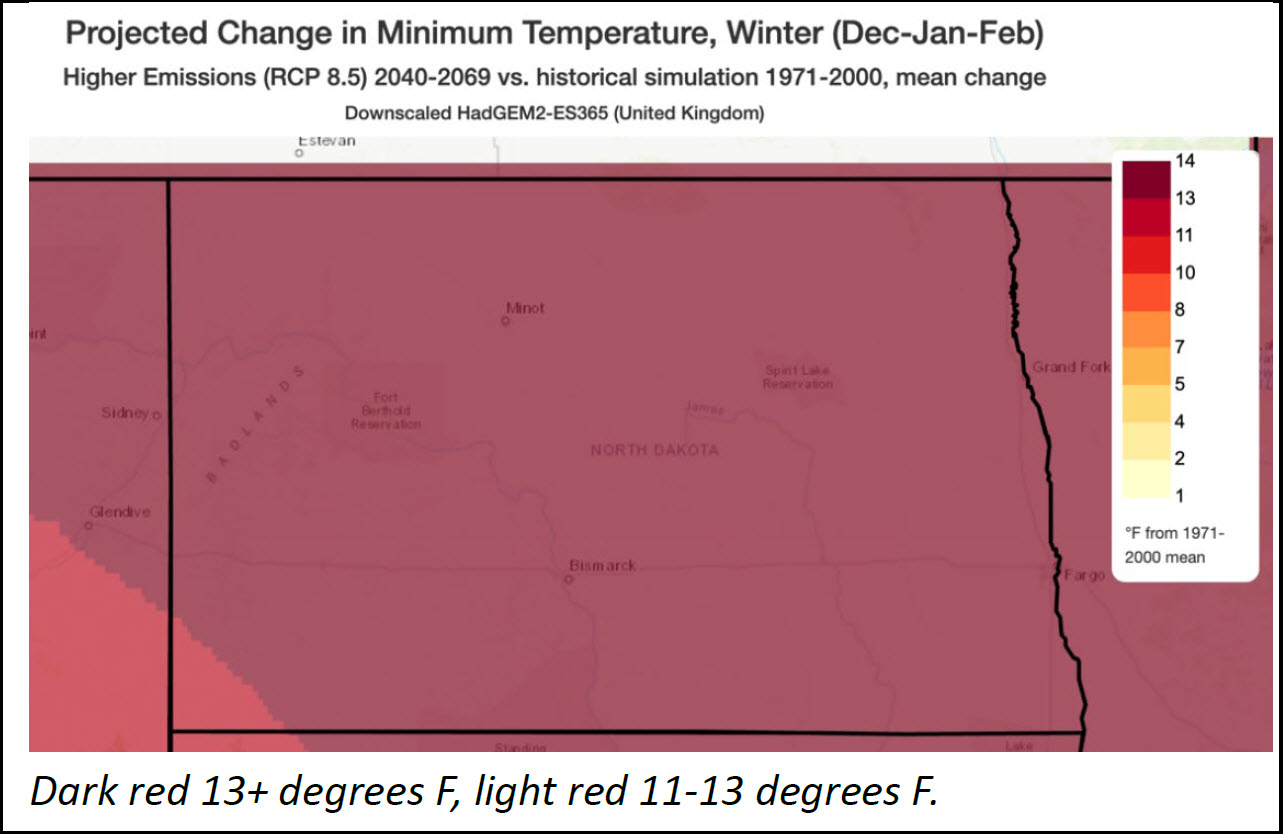
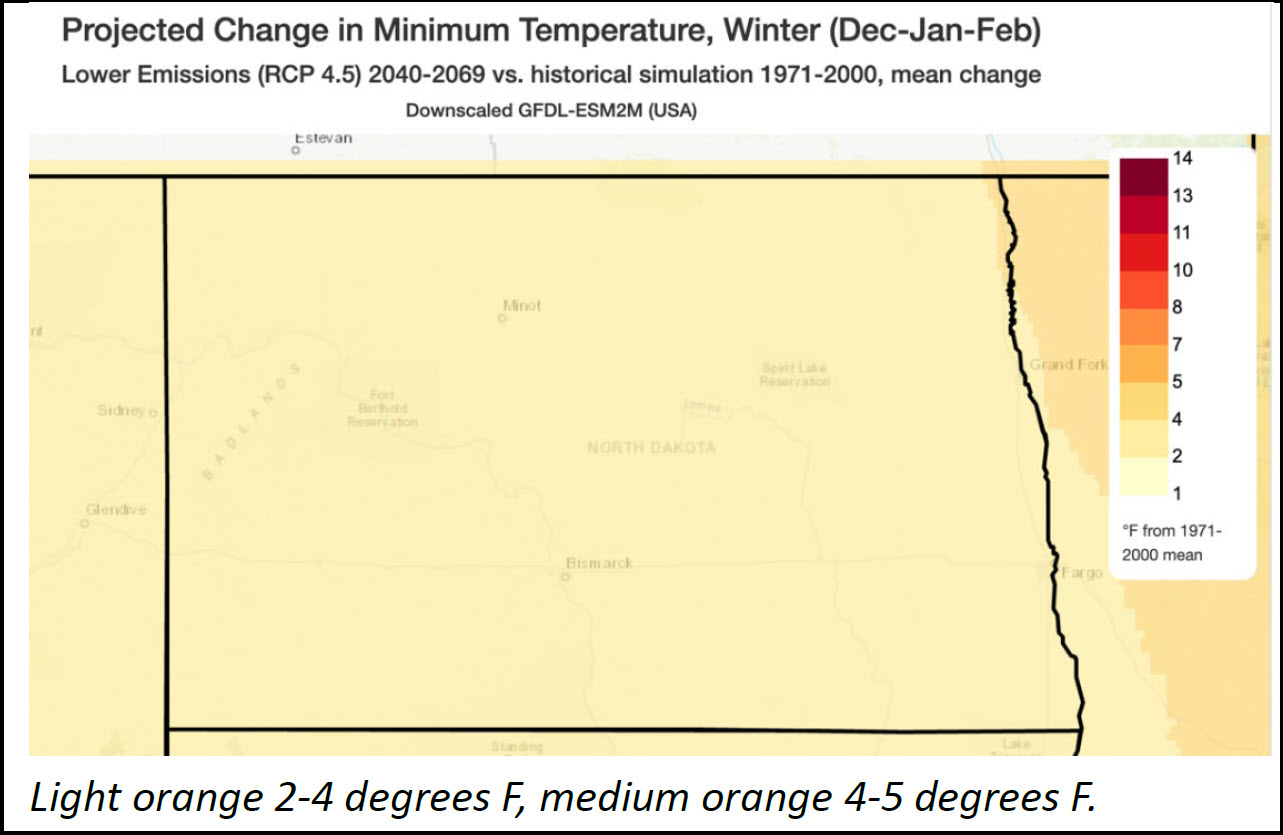
Figure 8. Projected change in number of hot days for both scenarios.
Change in Precipitation- Snow and Seasonal Dynamics
- From 1950 to 2010, the number of snow-cover days declined within the greater Northern Great Plains region (NCA5). Despite projected increases in wintertime precipitation (Figure 9), warmer temperature drives faster snow loss.
- The Northern Great Plains region is experiencing unprecedented extremes related to changes in climate, including severe droughts, floods, and wildfire. Flooding has been more common in the east while drought has been more common in the west in North Dakota (Figure 10).
- Flash droughts driven by warmer temperatures may increase in North Dakota.
- Heavier rainfall, combined with changes in land use and other factors is leading to increasing flood damage in the region (NCA5). There is a higher risk of floods with overall increasing projected precipitation in North Dakota, but the likelihood of these events is less certain due to high precipitation variability in climate projections.
Figure 9. Projections for percent change in precipitation across the four seasons for the ‘hot drought’ scenario.
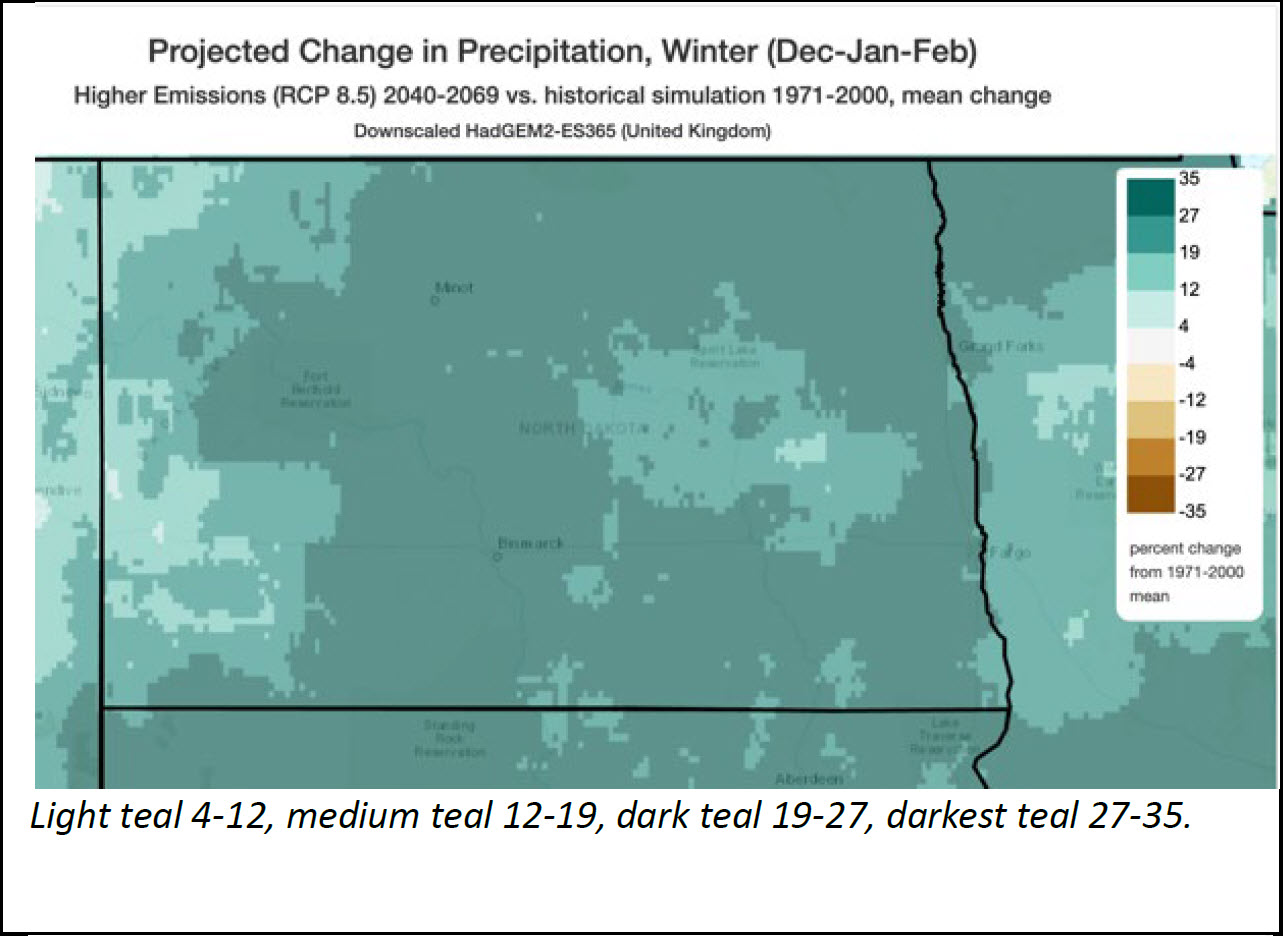
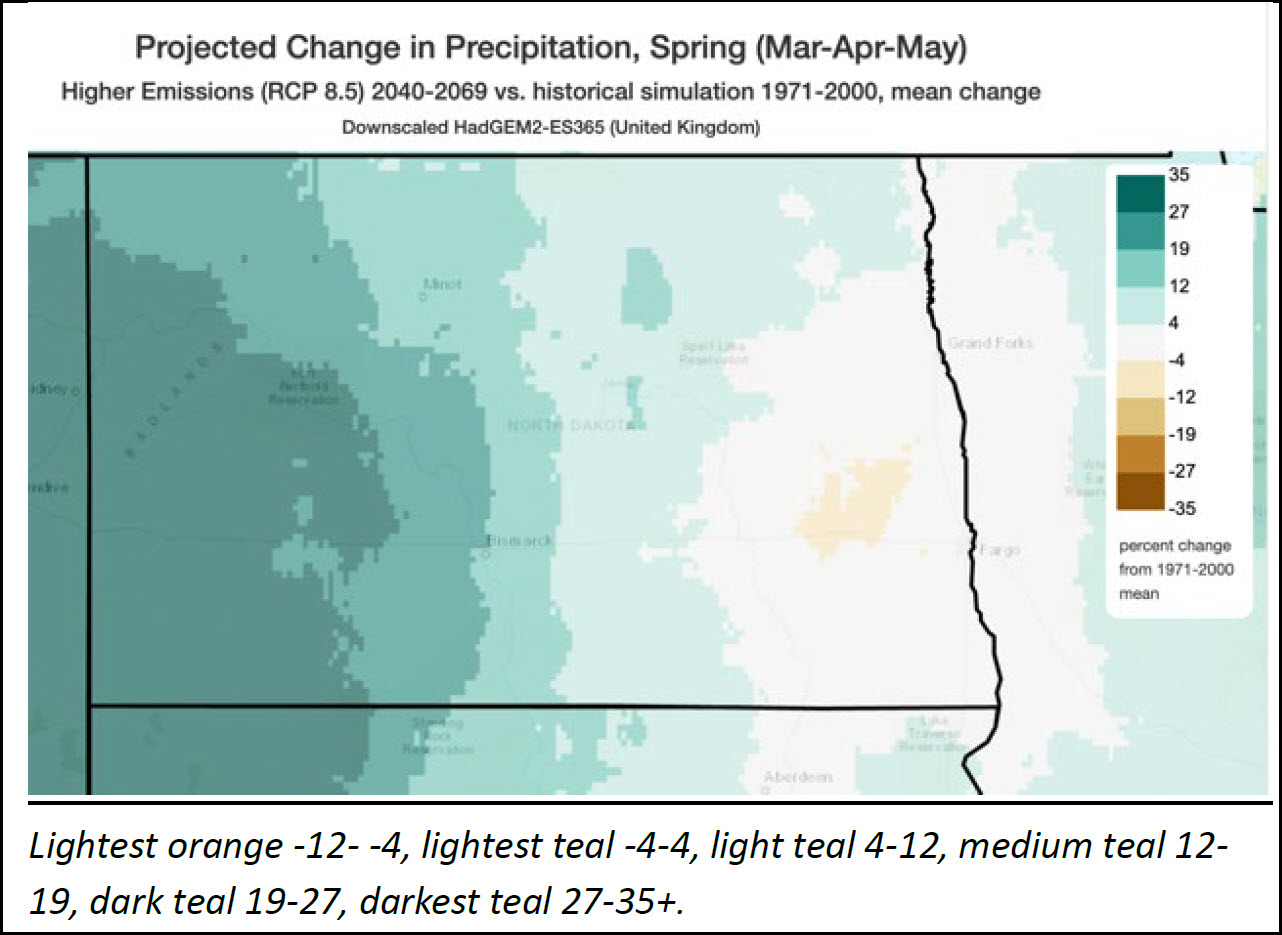
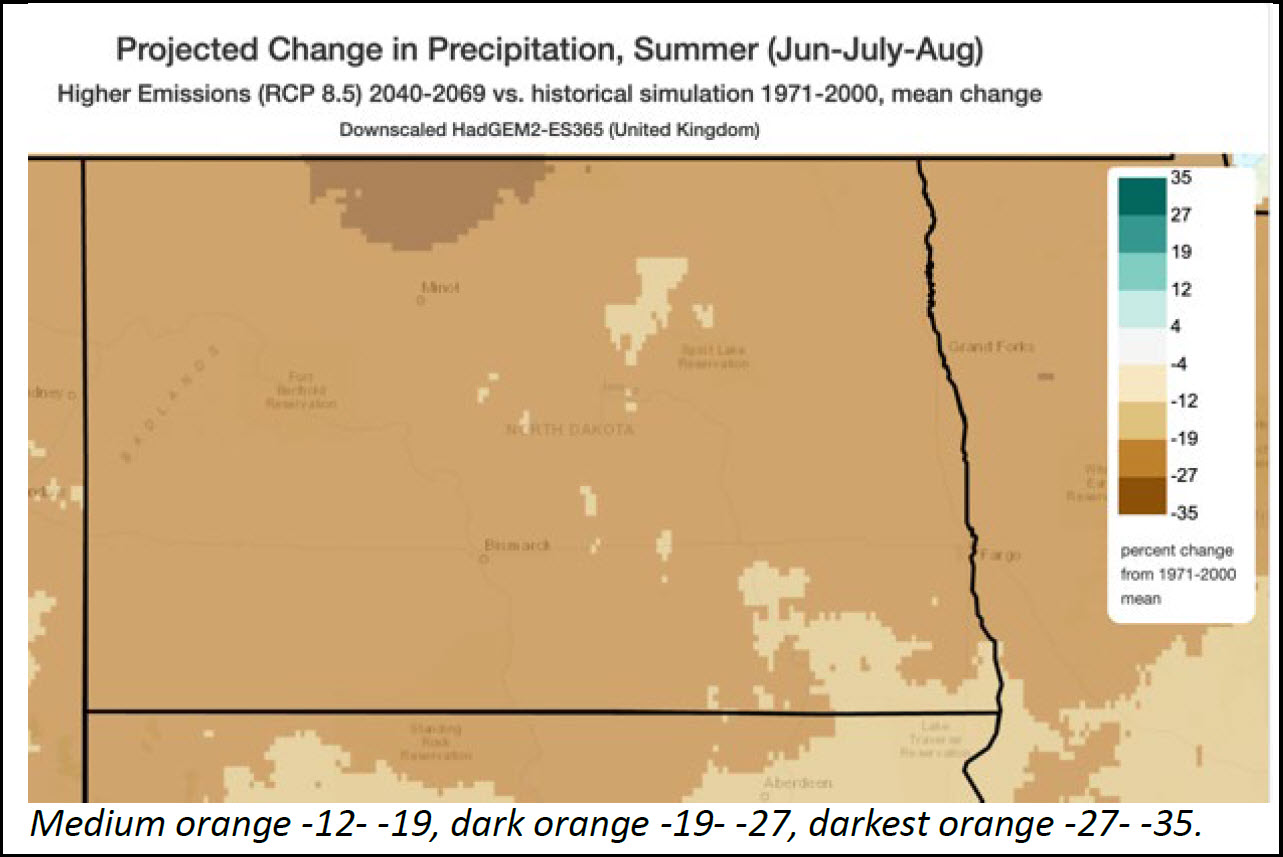
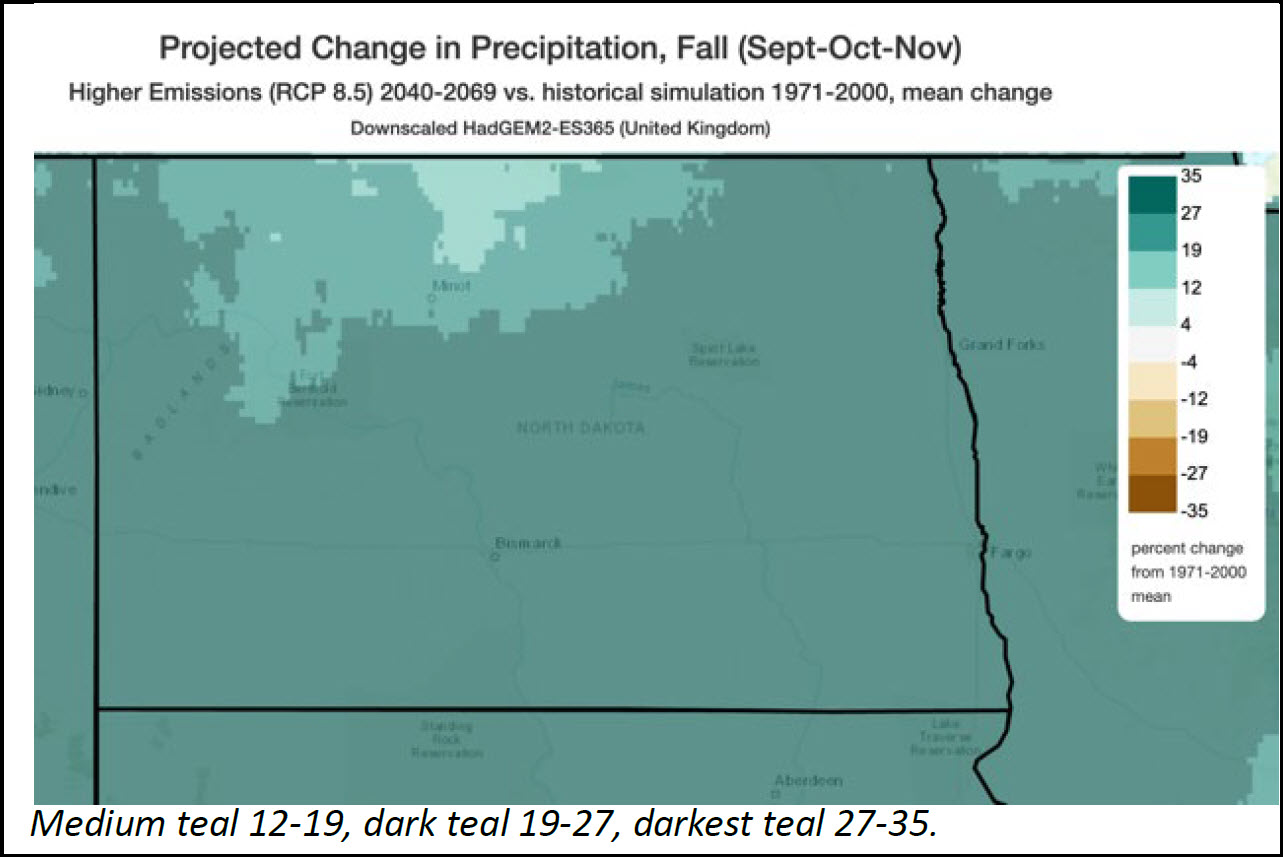
Figure 10. Projections for percent change in precipitation across the four seasons for the ‘warm and wet’ scenario.
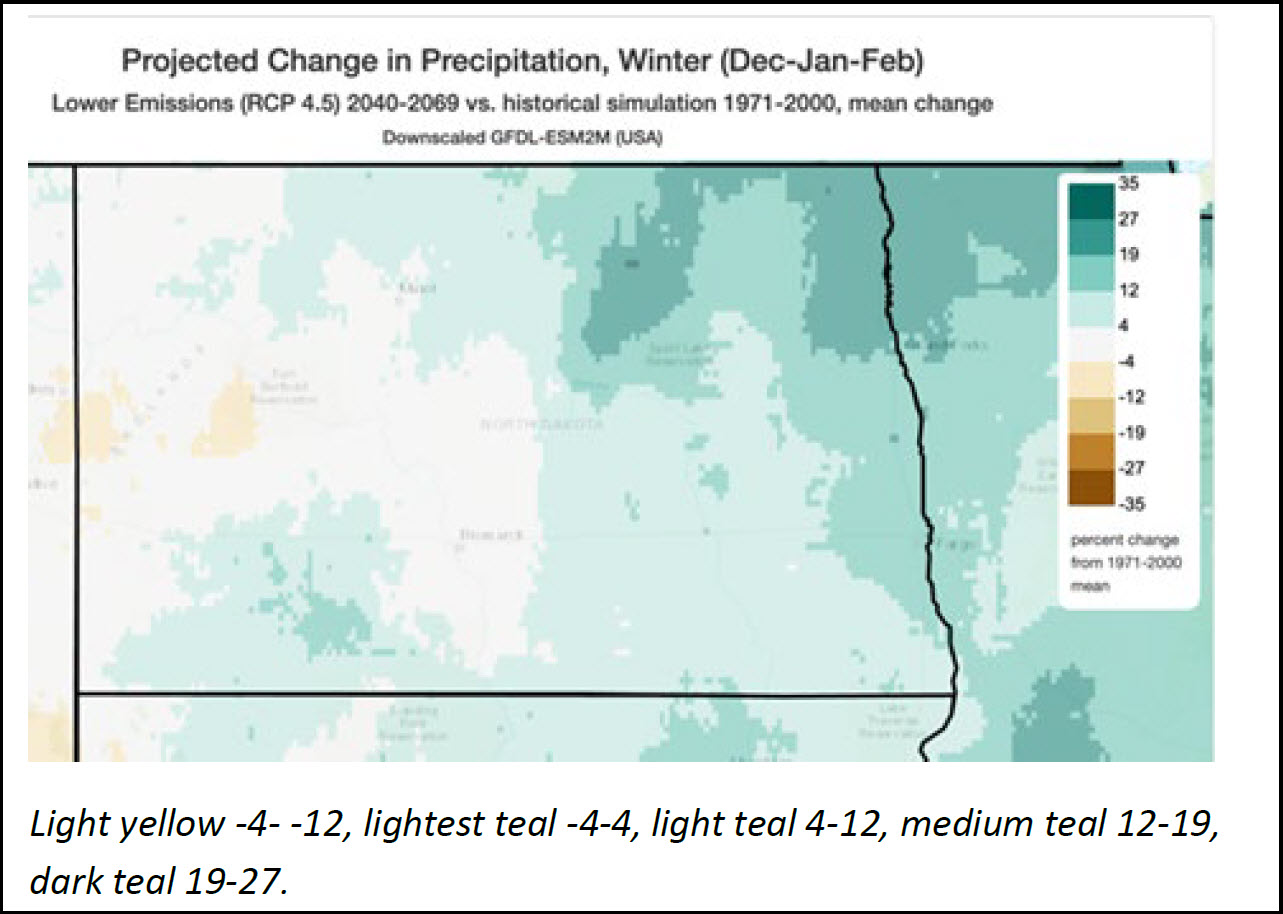
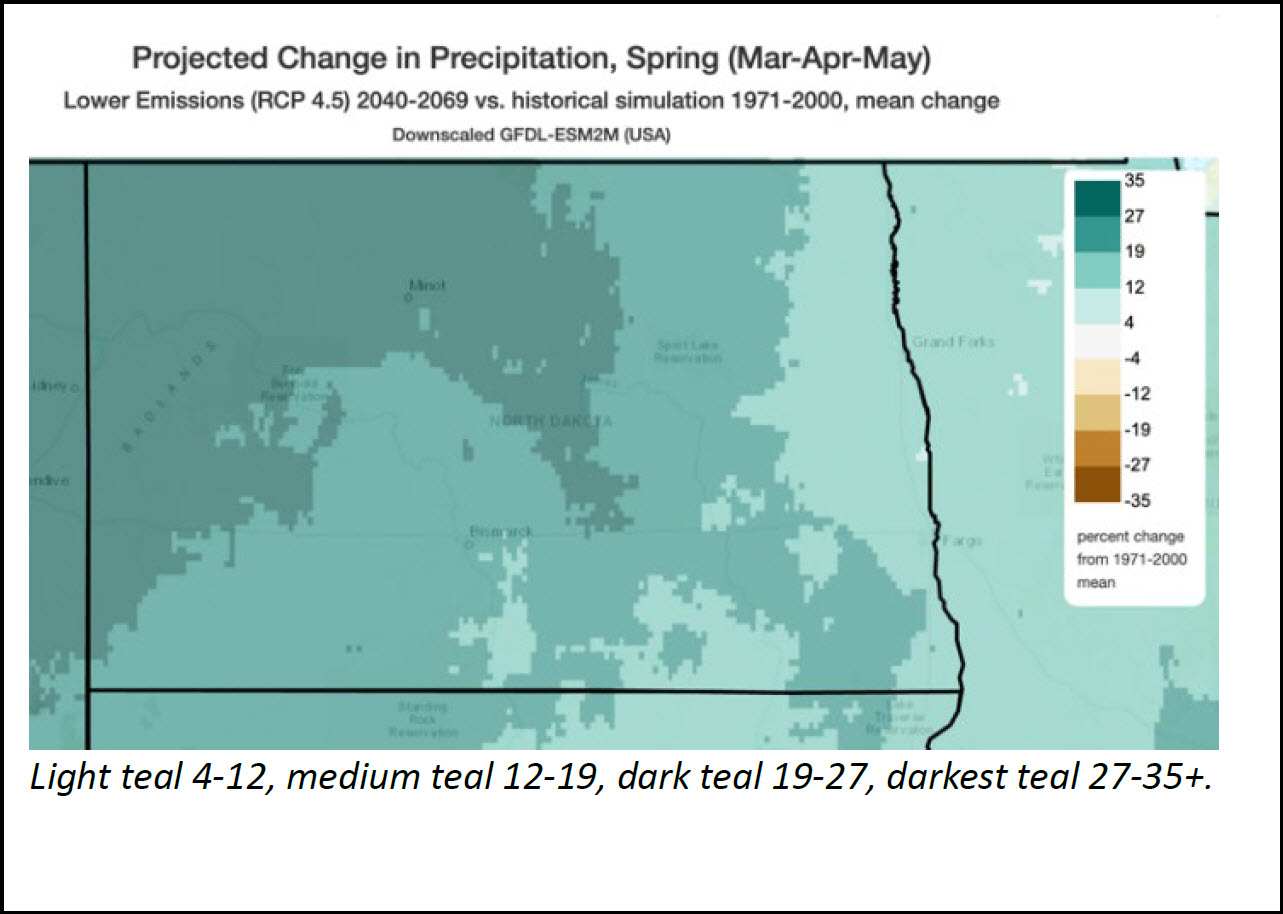
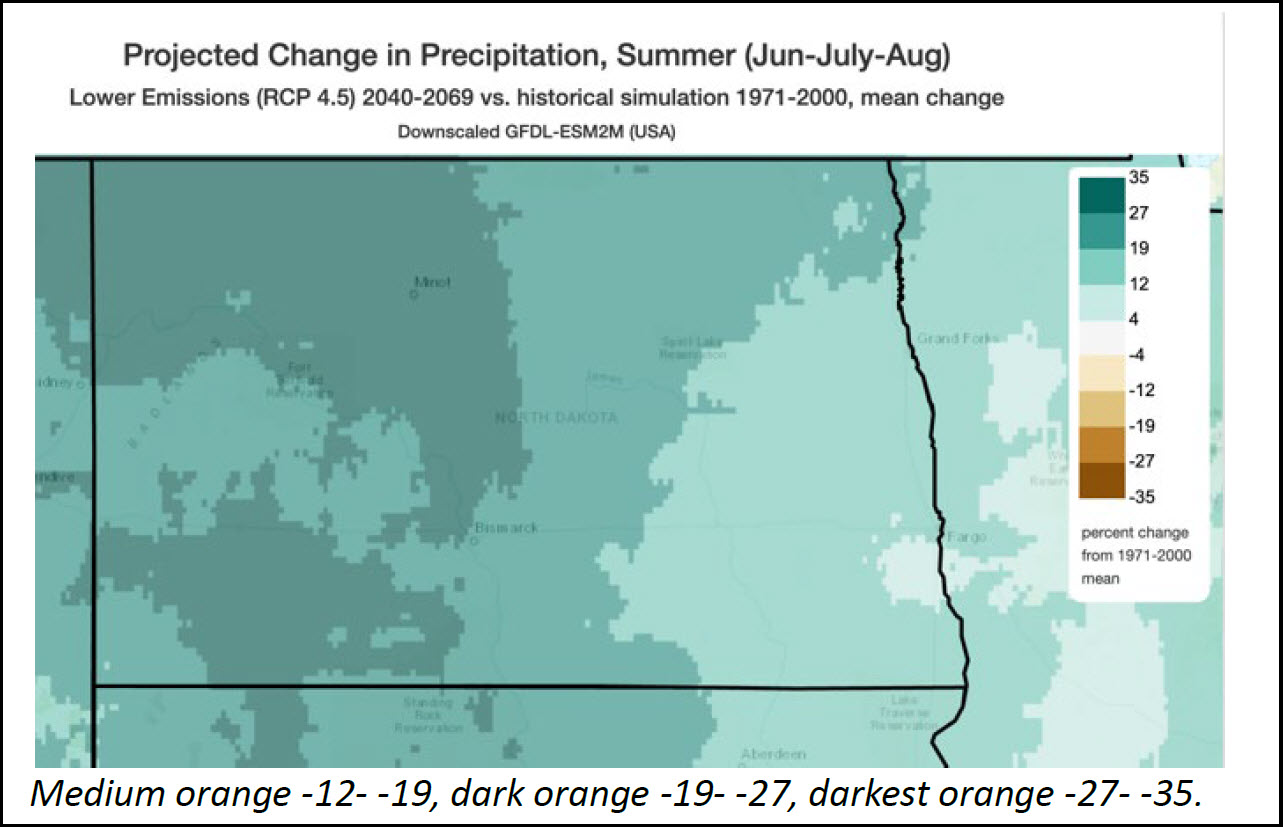
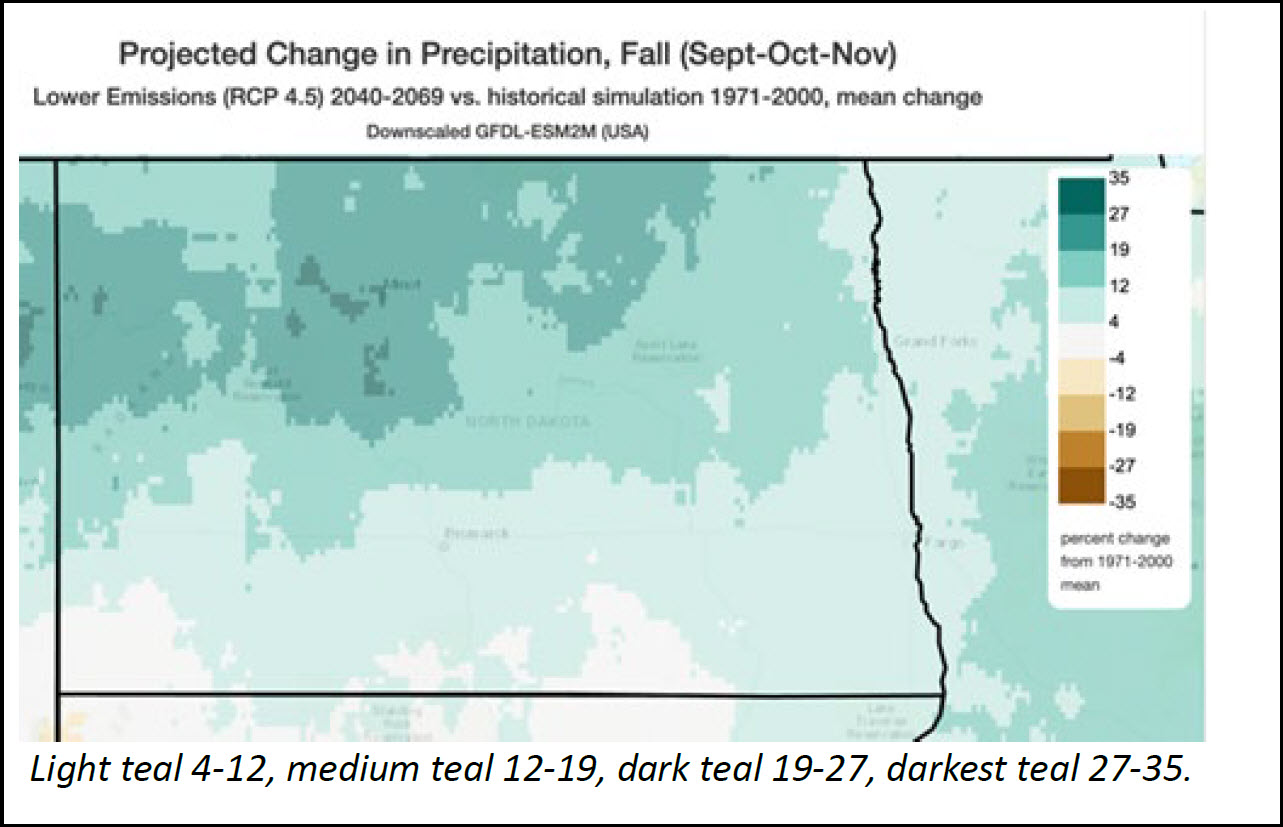
Figure 11. Water Resource Regions and Rivers, trends in annual peak streamflow, 1961-2020. (Figure credit: USGS, NOAA NCEI, and CISESS NC (NCA5))
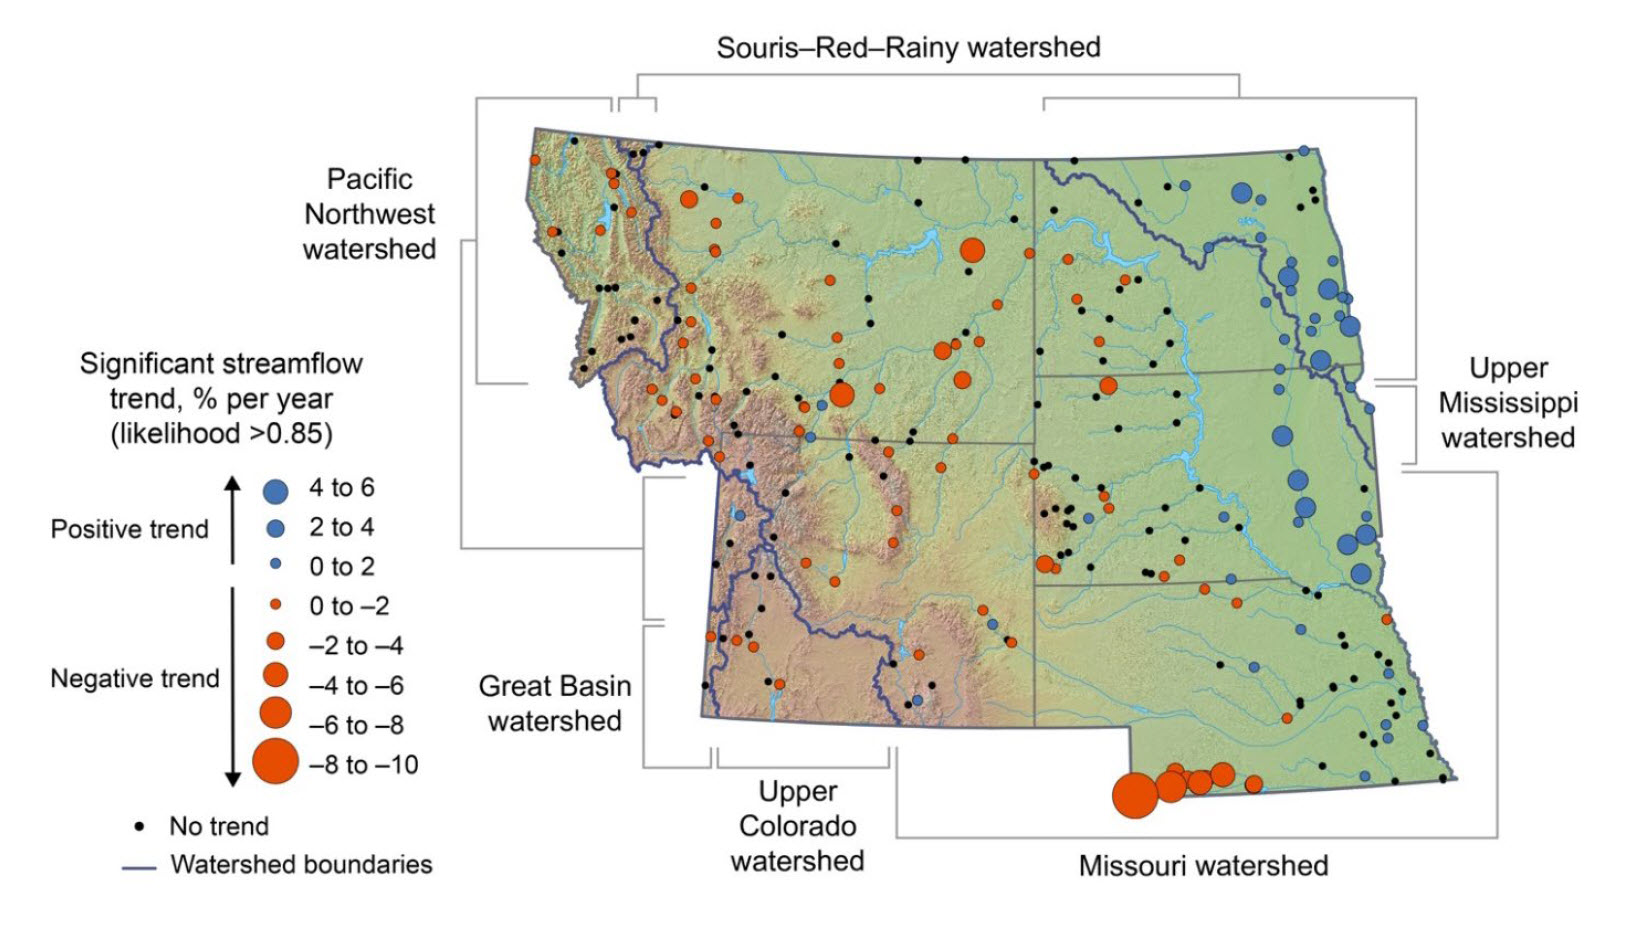
This map of the water resource regions and rivers within the region shows distinct east–west differences in trends in annual peak streamflow for 1961–2020, expressed as percent per year, where the size of the dot is relative to the size of the trend.
Red dots are downward trends, and blue dots are upward trends.
A likelihood-based approach is used to report these trend results.
When a trend is identified, the trend likelihood value (likelihood = 1 – p-value/2) associated with the trend is between 0.85 and 1.0.
In other words, the chance of the trend occurring in the specified direction is at least 85 out of 100.
Smaller black dots are sites for which there were sufficient data for trend analysis, but likelihood was less than 0.85; that is, these sites do not exhibit a substantial trend in either direction.
Adapting to a Changing Climate
Climate change can impact fish, wildlife, and the habitats they depend on in significant ways: shifts in species ranges, changes in behavioral or morphological traits, shifts in phenology, changes in species composition, increased pressure from non-native species, changes in predator/prey dynamics, etc.
With an understanding of how climate change, in conjunction with other stressors, might impact North Dakota’s wildlife and habitats, we can make more effective management decisions.
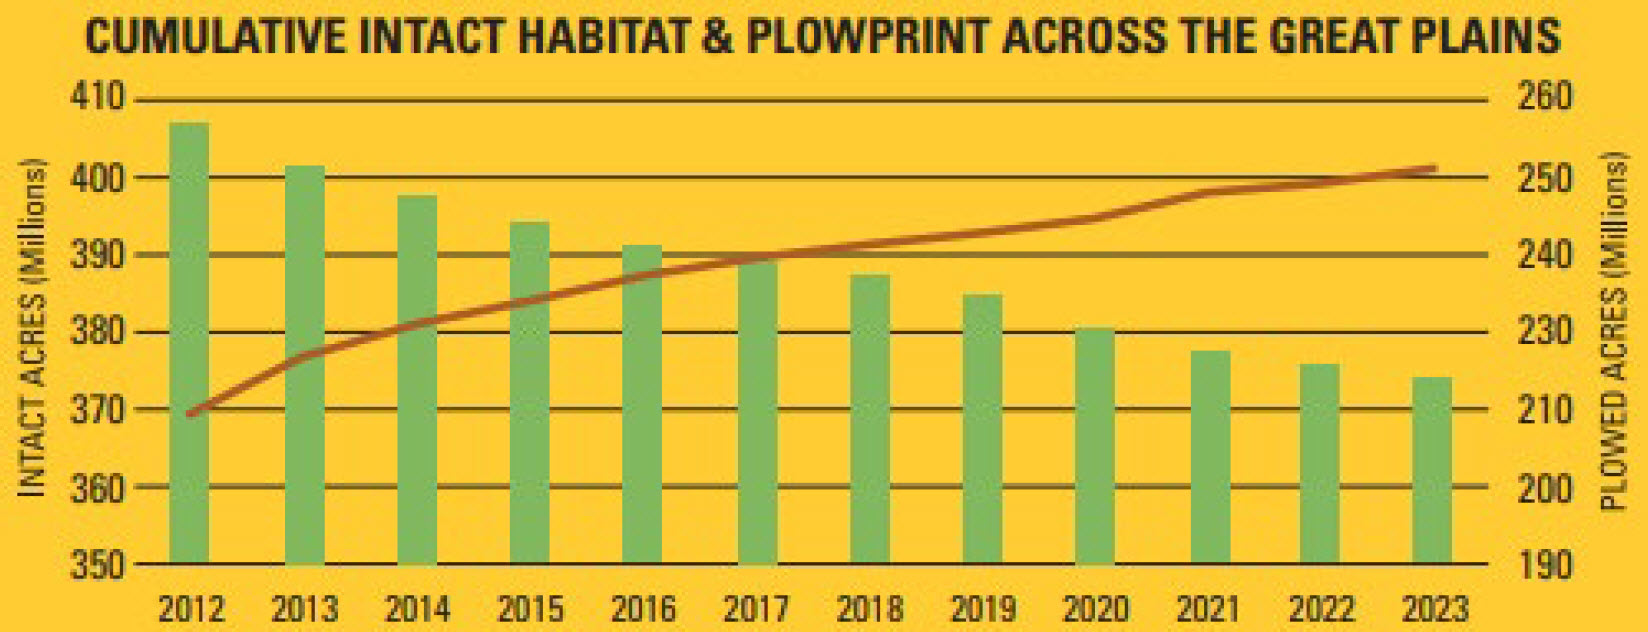
Climate Case Study: Climate Resiliency and Management Planning Conversion of native vegetation poses one of the greatest challenges wildlife face in North Dakota and throughout the Great Plains (Figure 12).
North Dakota has lost approximately 72% of its native grasslands, with conversion of the remaining grassland systems a continued threat (NDGF, unpublished).
As conversion continues across the landscape, landowner programs that aim to keep native habitats intact and the restoration of vital habitats are becoming critical practices to halt and reverse declines in biodiversity (Lyons et al. 2023, Menz et al. 2013, Suding et al. 2015, Torok et al. 2021).
There are several ways land managers might consider climate change while executing these practices.
Figure 12. Estimated intact grassland acres and plowed acres across the Great Plains from 2012 to 2023 (2024 Plowprint Report).
Because the amount of available native habitat is continually being reduced due to conversion, restoring habitat has become an important practice to ensure enough habitat remains on the landscape.
However successful restorations are expensive and require long-term commitments, limiting the amount of acres land managers can feasibly restore.
Acknowledging these obstacles, land managers are then charged with the difficult task of ensuring limited resources go towards projects that will provide the greatest “bang for their buck”.
One way land managers can begin to prioritize is by considering a changing climate and the projects’ ability to aid in climate resiliency.
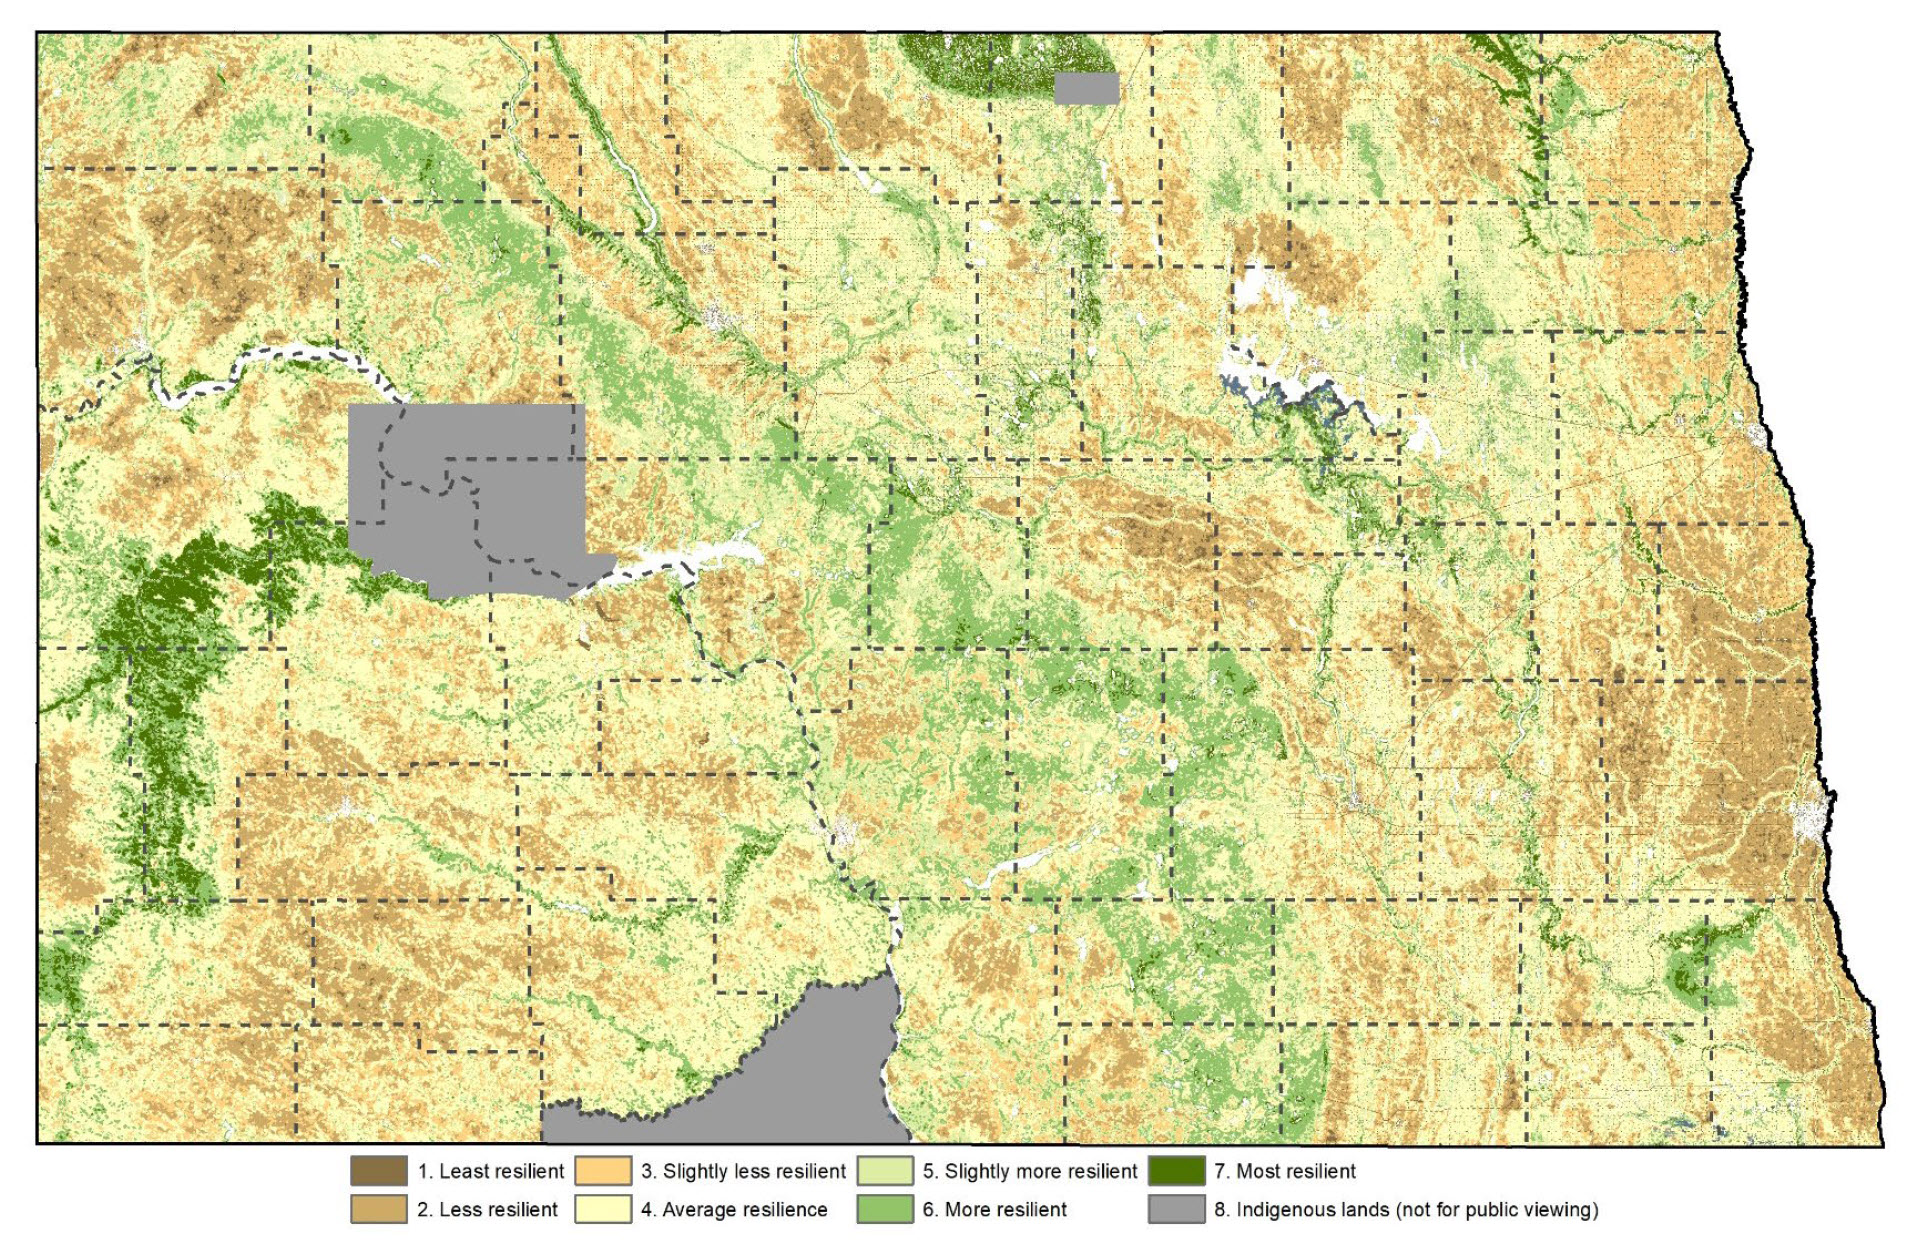
The Midwest Landscape Initiative, using data from The Nature Conservancy, has mapped areas throughout the Midwest that are climate resilient.
Climate resiliency identifies lands and waters that can properly function under changing climate conditions.
These areas are prioritized based on landscape diversity and connectedness.
Components of the dataset include data from the resilient and connected network (RCN), recognized biodiversity values, connectivity and climate flow scores, geophysical settings, landforms, landscape diversity values, local connectedness metrics, and terrestrial resilience scores.
The map in Figure 13 shows the least resilient to the most resilient lands based on these data.
Using this information, land managers can make better decisions on where to prioritize restoration projects.
Area’s that are most resilient are comprised of healthy native communities and restoring areas adjacent to these parcels can expand and/or connect these areas of refugia and will likely have much greater benefits than restorations done in areas surrounded by least resilient lands.
Figure 13. Priority areas based on landscape diversity and connectedness (Midwest Conservation Blueprint).
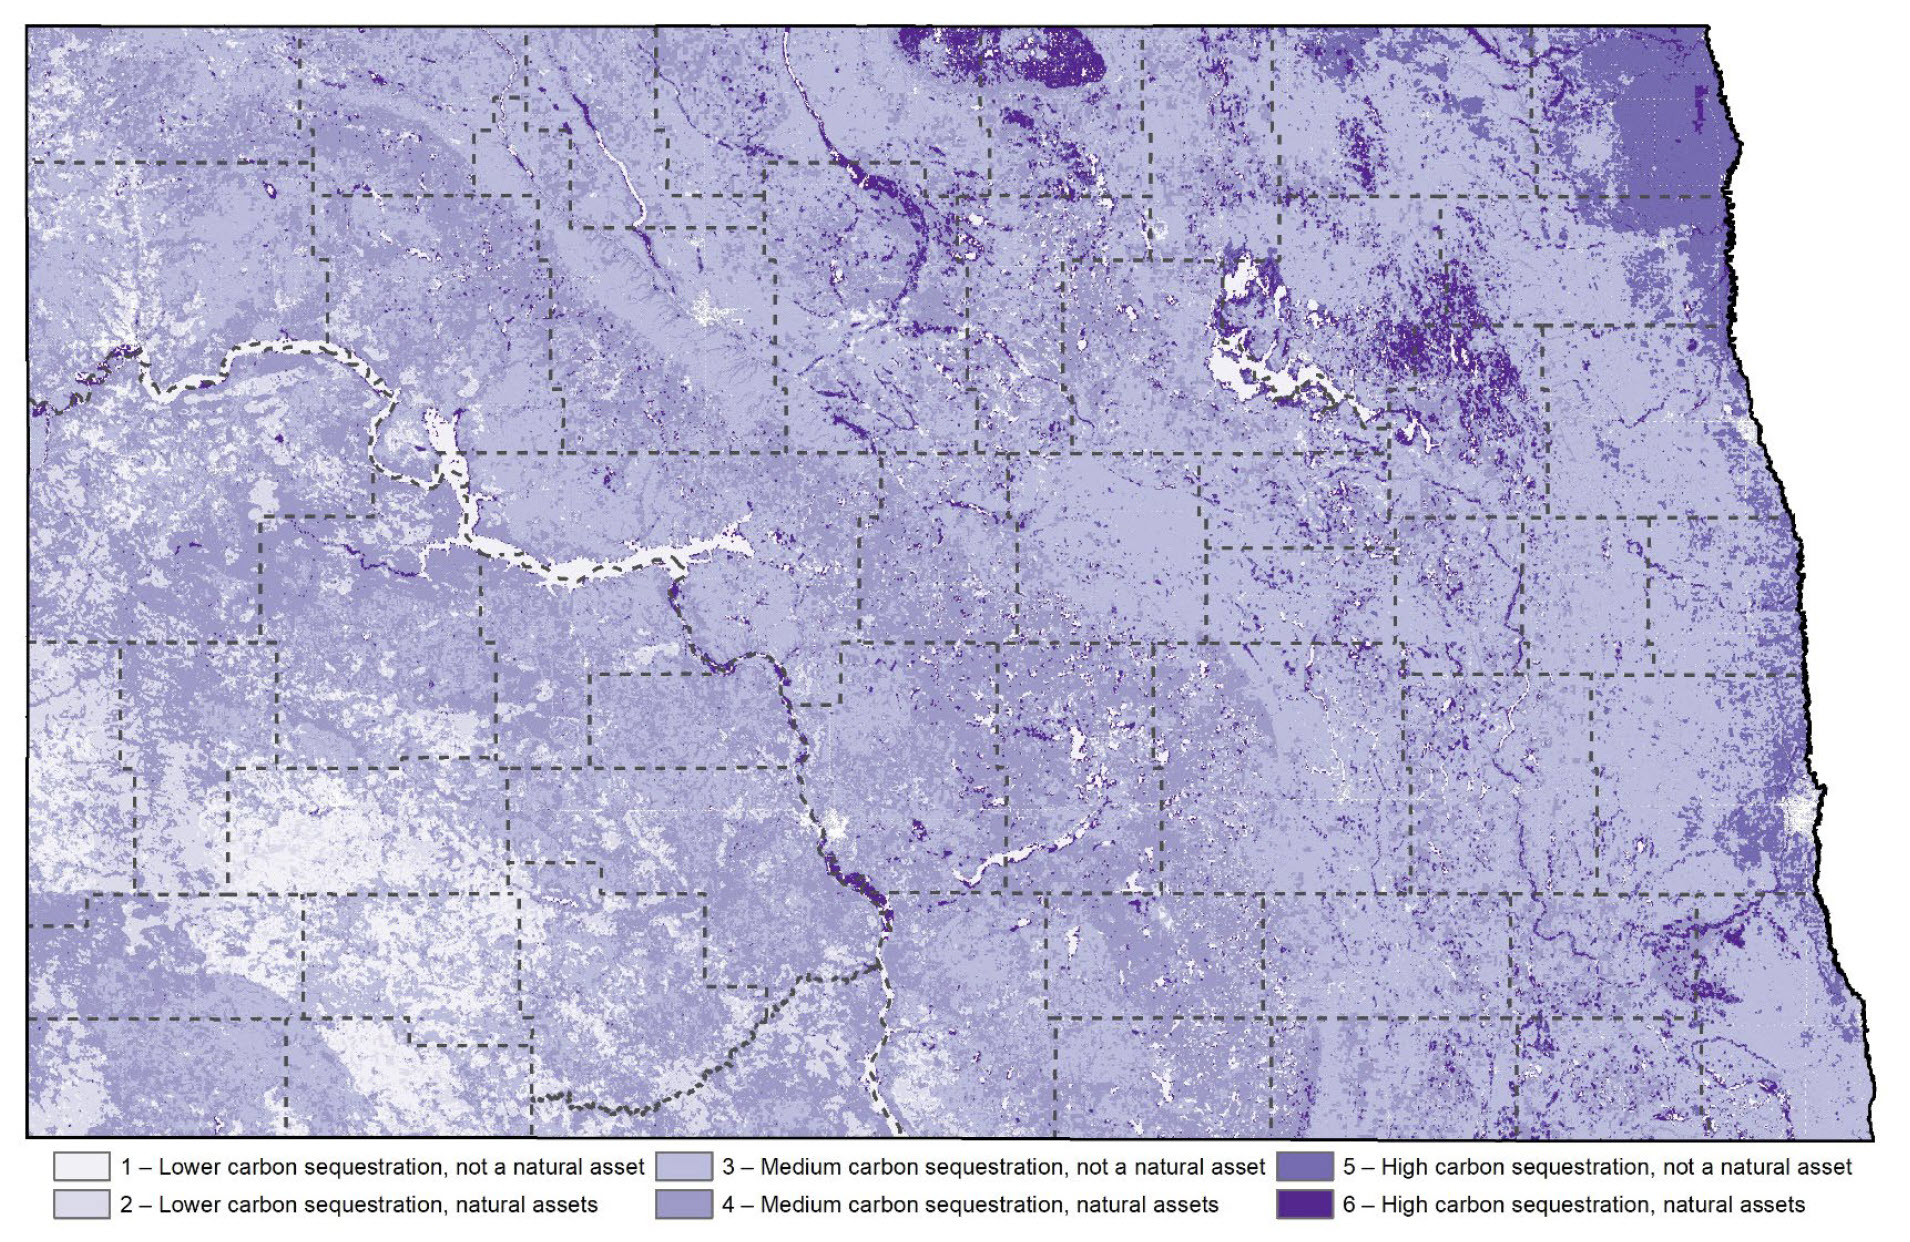
Like the climate resilient lands, the MLI, using the UN Environment Program World Biomass and Soil Carbon dataset (Soto-Navarro et al., 2020), has also mapped areas of climate resilience with a focus on carbon sequestration (Figure 14).
These areas are prioritized based on the amount of above and below ground carbon stored.
Areas that store higher amounts of carbon will play an important role in long term climate trends. Land managers can utilize this data to prioritize areas to protect, focusing on those with a higher capacity to store carbon.
Figure 14. Priority areas based on the amount of above and belowground carbon stored (Midwest Conservation Blueprint).